Northwestern Home Page          S P E A R Capabilities

The results presented here are intended to suggest some of the possiblities utilizing the SPEAR system

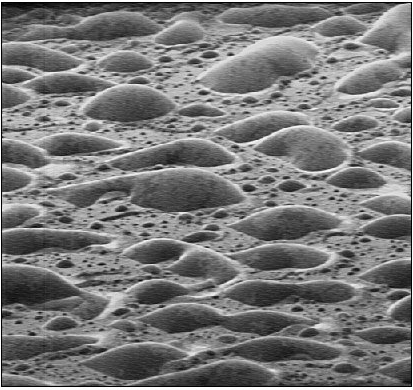
SEM image of Ga islands on the surface of a GaAs sample.

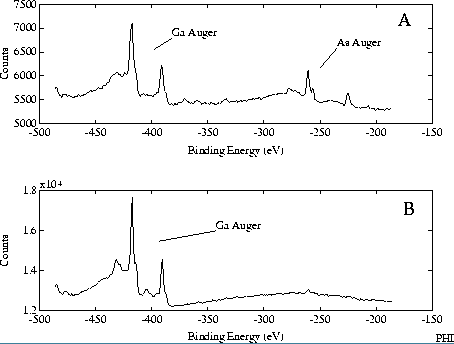
Auger spectra taken from in A) the region between the islands and in B) the Ga islands.

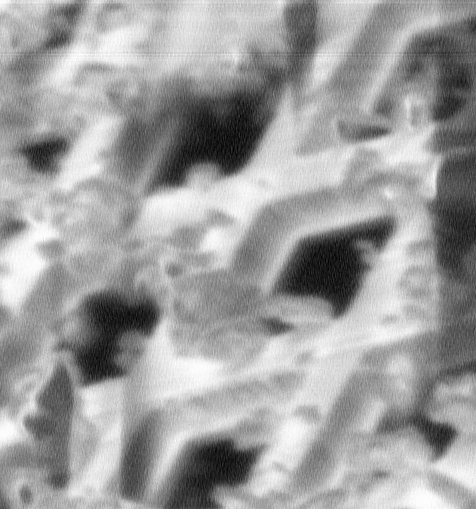
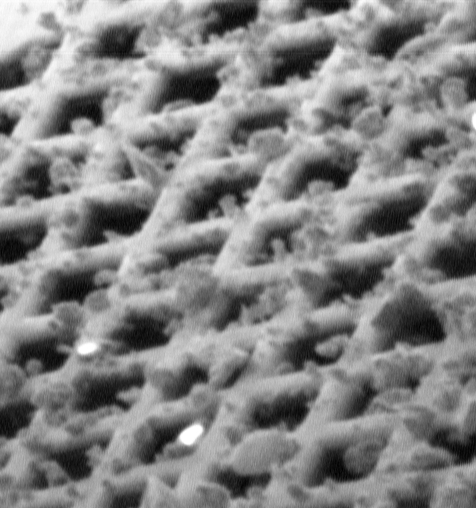
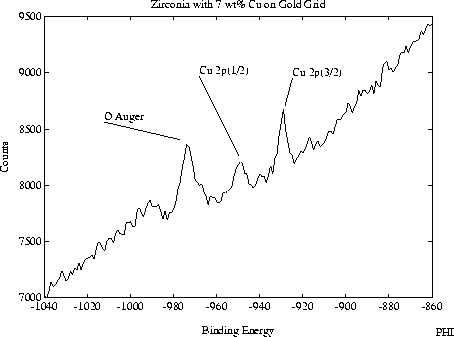
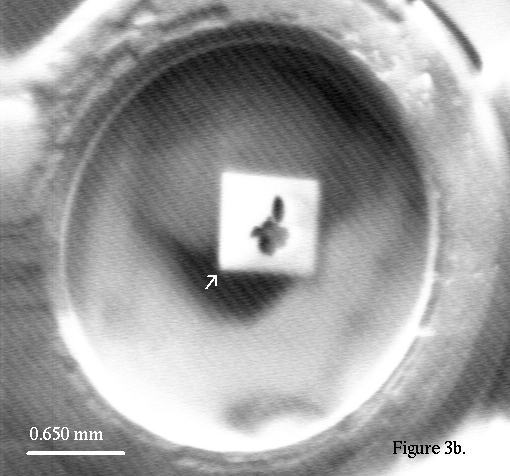
SEM images of a Cu/Zirconia catalyst sample supported on a gold microscope grid.

XPS spectra with 7 wt.% Cu in the Zirconia powder with an surface area coverage of 10-20%.


Figure 3a is a secondary electron image during the milling of a Si(111) sample using a 1.5 kV oxygen ion beam using the Duoplasmatron Ion Source and microbeam ion gun column . The arrowed white box located at the center of Figure 3b corresponds to the region in the first image following a 5 minute oxygen ion beam mill normal to the surface. Figure 3c is an image of the sample surface using a 4 kV argon ion beam. The arrowed dark rectangle inside of the white box corresponds to a region milled for 8 minutes using a 1.5 kV argon ion beam with